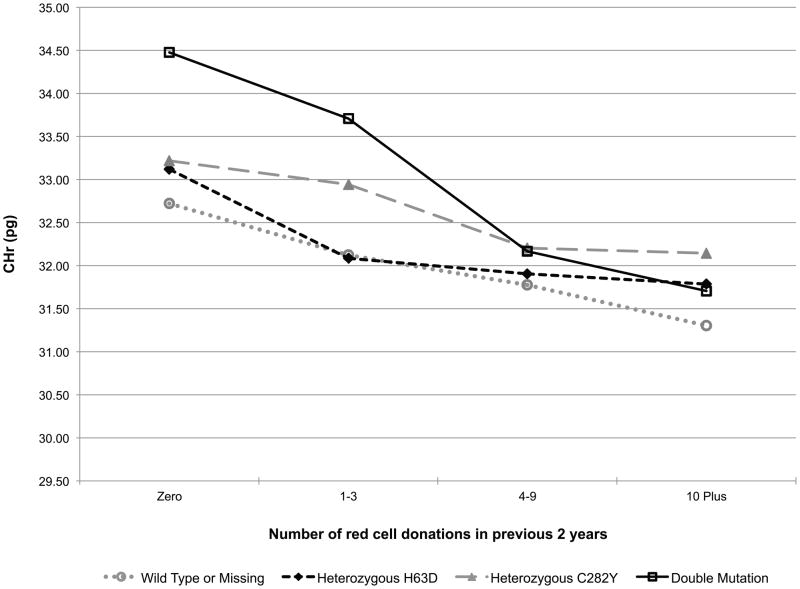
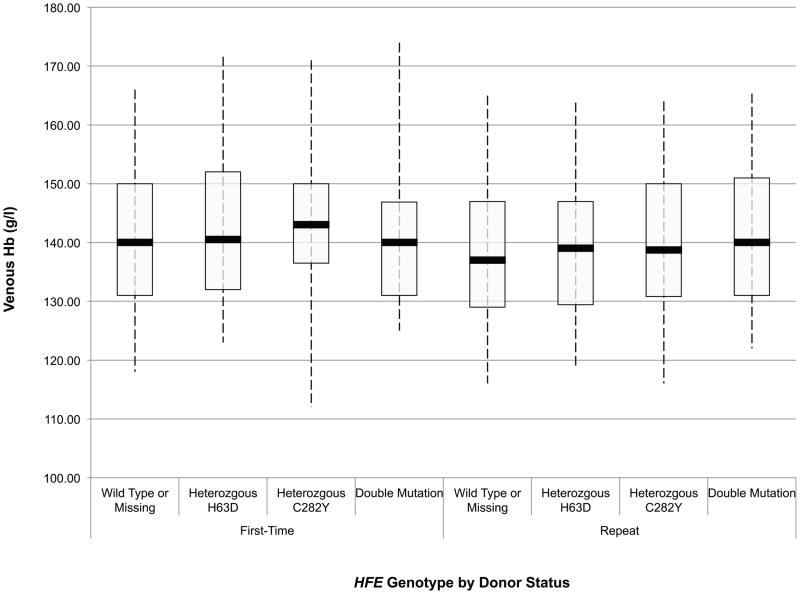
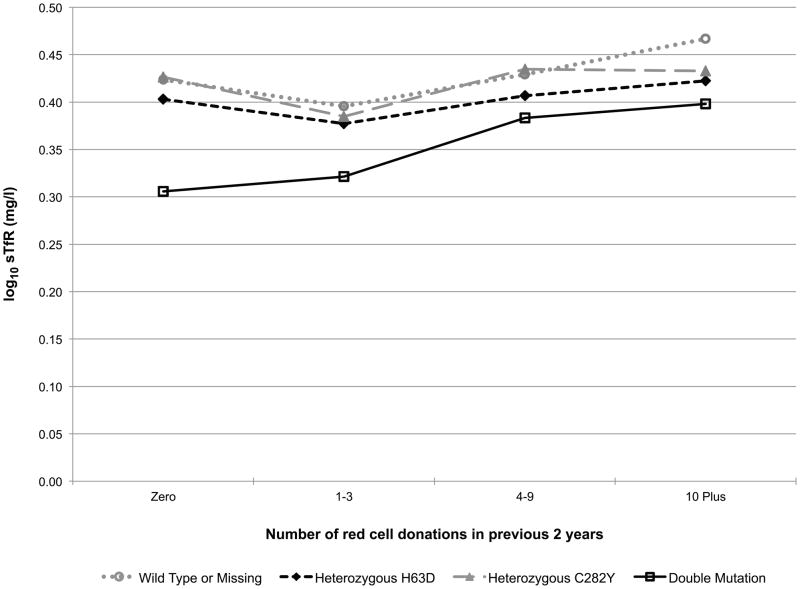
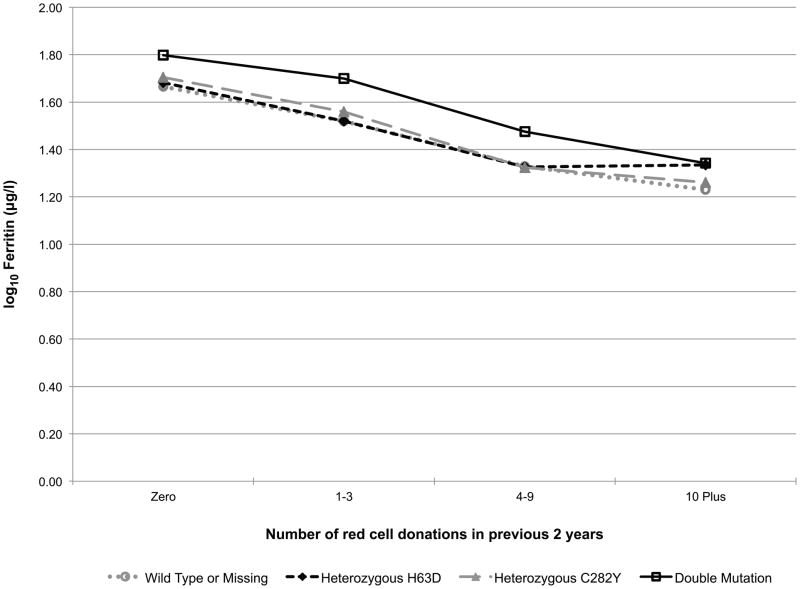
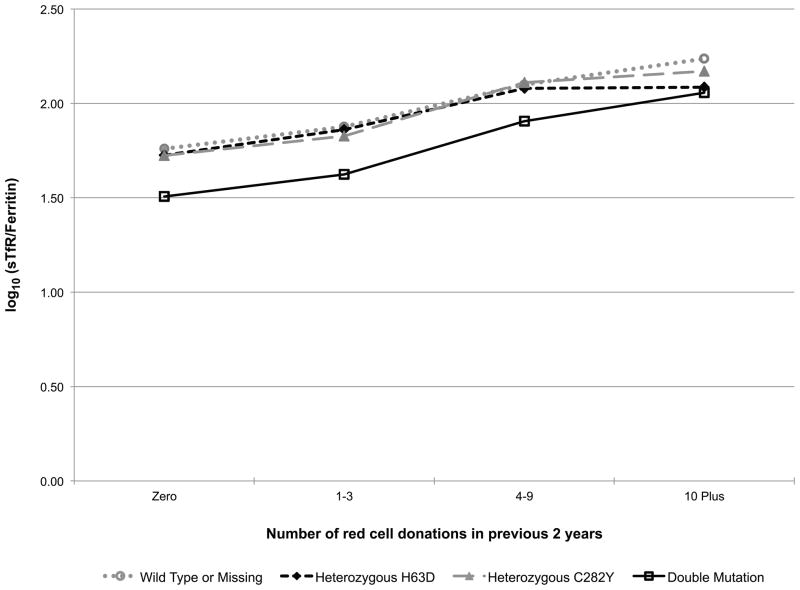
Fig 2.
Predicted changes in measures of haemoglobin and iron status with increasing donation intensity by HFE genotype. The analyses to generate the lines used information from the REDS-II donation database to determine the 24-month donation intensity for the frequent donors at each donation during the study. Individual donors contributed to different data points depending on changes in their 24-month donation intensity at the time of their study donations. A) CHr; B) venous haemoglobin; C) log(sTfR); D) log(ferritin); E) log(sTfR/ferritin).

