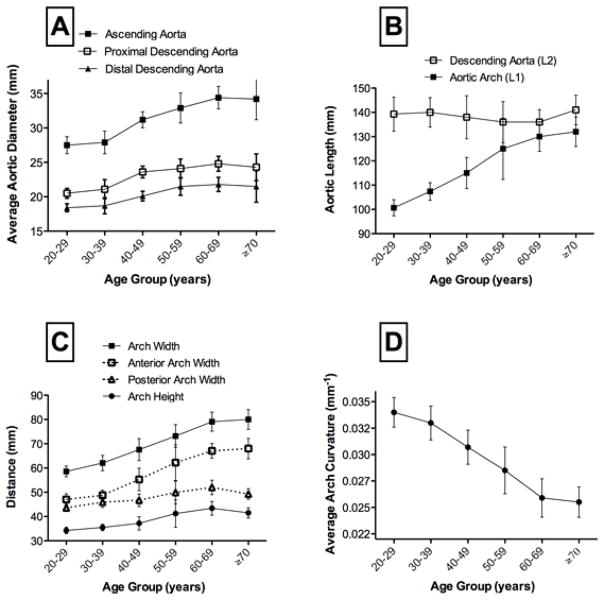
Figure 2. Effect of Age on Measures of Aortic Geometry.
Relationship with age of : Panel A: ascending and descending proximal and distal aortic diameters. Panel B: aortic arch and descending aortic lengths. Panel C: breakdown of local aortic arch dimensions. Panel D: average aortic arch curvature. Age group sample size: 20–29 years: n=20, 30–39: n=16, 40–49:n=26, 50–59:n=15, 60–69:n=13, >70:n=10. Statistical significance for trend across age categories : *p<0.0001, †p<0.01, ‡p=0.09.

