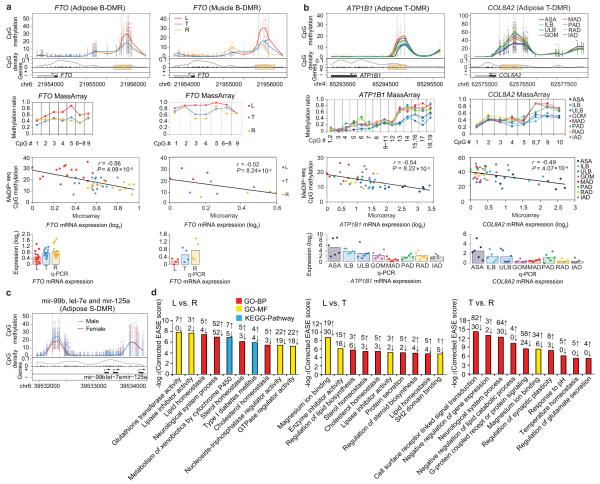
Figure 7. Examples of obesity-related genes and functional gene categories showing differential DNA methylation in promoters.
(a) The adipose and muscle B-DMR in FTO promoter. Top panels: top half: CpG methylation. Each point represents methylation level (MeDIP-seq read depth) of a sample at a given CpG site. The curves showed average over the samples. The two vertical dashed lines marked the boundaries of the DMR identified. Lower half: CpG dinucleotides (black tick marks on X axis), CpG density (gray line), TSS (black arrow), exons and introns (filled black and white boxes, respectively). Plus and minus marks denote sense and antisense gene transcription. Second panels: validation of individual CpG methylation by MassArray (mapping to yellow box in upper panel). Third panels: a scatter plot and trend line (Pearson correlation) showing correlation between the log2 ratios of mRNA expression from microarray and CpG methylation of the DMR from MeDIP-seq. Bottom panels: validation of mRNA expression levels by q-PCR. Bars represent the mean expression level.
(b) The adipose T-DMR in ATP1B1 and COL8A2 promoters.
(c) The adipose S-DMR in miRNAs mir-99b, let-7e and mir-125a promoters.
(d) Top ten GO (Gene Ontology) and pathway categories enriched for adipose B-DMRs in promoters. The enrichment analysis was performed using the DAVID software59 (see Supplementary Methods). The EASE score, indicating significance of the comparison, was calculated using Benjamini corrected modified Fisher’s exact test. BP: biological process, MF: molecular function.

