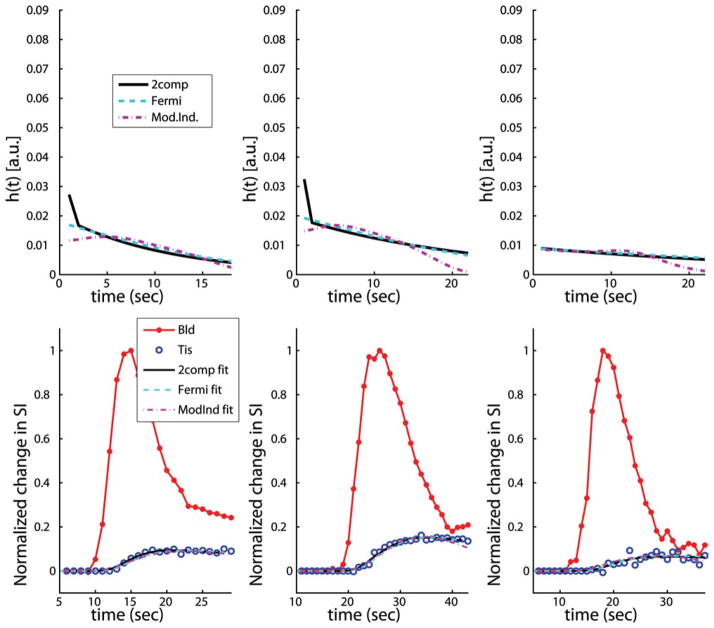
FIG. 1.
Representative plots of typical h(t) curves (top row) from three subjects in the study at rest, along with the estimated tissue enhancement model fits (bottom row) using two-compartment modeling, Fermi function modeling, and model-independent analysis (not Patlak plot analysis). In general, estimates of myocardial perfusion from all three of these deconvolution models are proportional to the maximum amplitude of h(t). However, when Vb is nonzero in the two-compartment model an additional δ function, scaled by Vb, is added to h(t = 0).

