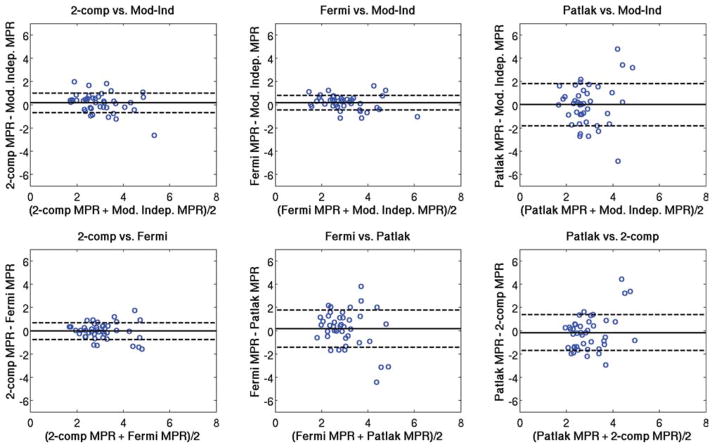
FIG. 7.
Bland-Altman plots showing the comparison of mean MPR values between each of the four quantitative analysis methods used in this study. The same axis value ranges were used in each case to facilitate comparisons. [Color figure can be viewed in the online issue, which is available at www.interscience.wiley.com.]

