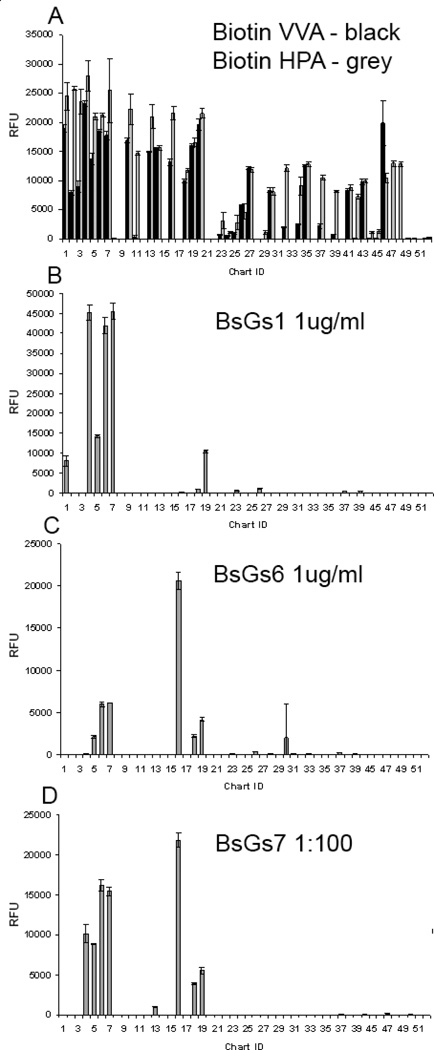
Figure 4.
(A) Binding profile of biotinylated HPA lectin (grey bars) and biotinylated VVA lectin (solid black bars) both at 1 µg/ml detected with Cyanine5-labeled streptavidin. Binding profiles of (B) BaGs1 antibody representative of BaGs1, 2, 3, and 4, and (C) antibody BaGs6, representative of BaGs5 and 6 binding profiles. mAbs were assayed at10 µg/ml detected with AlexaFluor488-labeled anti-mouse IgM (5 µg/ml). (D) Binding profile of BaGs7 antibody (1:100 dilution of ascites fluid) detected with AlexaFluor488- anti-mouse IgM (5 µg/ml). Error bars represent +/− 1 SD. RFU = relative fluorescence units. ID corresponds to Table 2.

