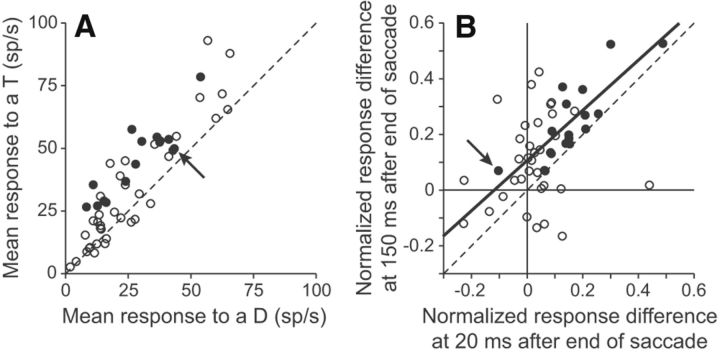
Figure 4.
Responses during fixation are similar to responses during the remapping period. A, The mean response to a potential target is plotted as a function of the mean response to a distractor for all neurons in a 25 ms window centered 150 ms after the end of the last saccade. Filled points indicate which individual neurons showed a significant difference between responses in the remapping period, i.e., the significant neurons from Figure 3A. The arrow indicates the neuron that had a greater response to a distractor in the remapping period. B, The relative NRDs between a potential target and distractor from a 25 ms window centered 150 ms after the end of the last saccade are plotted as a function of the NRDs between a potential target and distractor from a 25 ms window centered 20 ms after the end of the last saccade. The absolute differences were divided by the sum of activity from the activity recorded at 150 ms for both axes. The solid line shows the line of best fit for all the filled neurons. Other conventions as in A.

