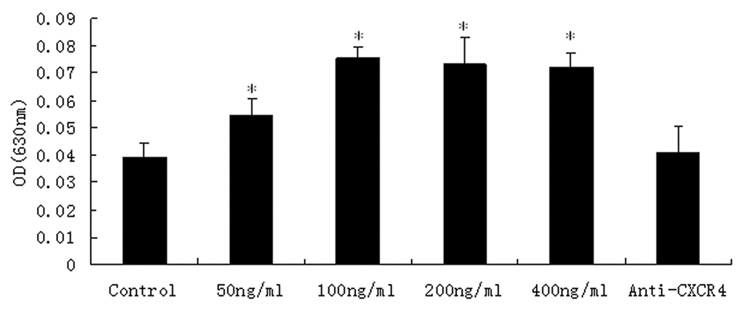
Figure 5. Effects of different concentrations of SDF-1α on the migration of DPCs.
The data represent the mean ± SD. The OD of 50ng/ml SDF-1α was higher than the control group. In 100ng/ml, the OD reached the highest point. The OD of anti-CXCR4 group has not significant difference with the control. *P<0.05 as compared with the control group.

