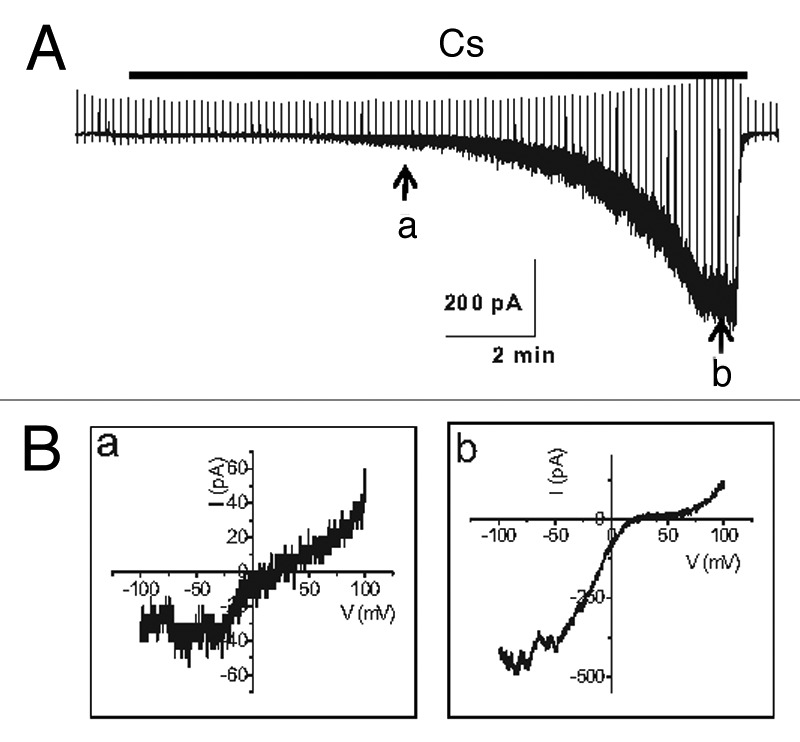
Figure 4. Current trace in the activation of TRPC4β by Gαi2. (A) Representative current traces recorded at -60 mV. The time course of activation of TRPC4β by Gαi2 was delayed in the presence of 10 mM EGTA in the patch pipette, in contrast to the current recorded with the low-calcium buffered internal solution (0.5 mM EGTA). (B) The current-voltage (I-V) relationship of TRPC4 showed a typical doubly rectifying shape. The I-V relationship shown in a and b was obtained at point a and b of (A).
