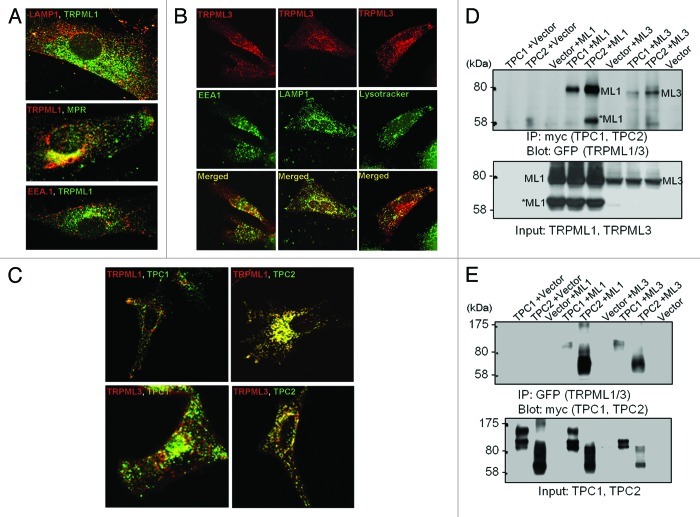
Figure 1. Distribution of the TRPMLs and TPCs in intracellular organelles. Panel (A) shows the localization of TRPML1 relative to the organellar markers LAMP1, MRP and EEA.1. The images were taken from.37 Panel (B) shows the localization of TRPML3 relative to the organellar markers LAMP1, lysotracker and EEA.1. The images were taken from.38 Panel (C) shows the localization of TRPML1 and TRPML3 relative to the localization of TPC1 and TPC2 and panel (D) shows the Co-IP of the TRPMLs and TPCs. The results in (C and D) were taken from.78

An official website of the United States government
Here's how you know
Official websites use .gov
A
.gov website belongs to an official
government organization in the United States.
Secure .gov websites use HTTPS
A lock (
) or https:// means you've safely
connected to the .gov website. Share sensitive
information only on official, secure websites.
