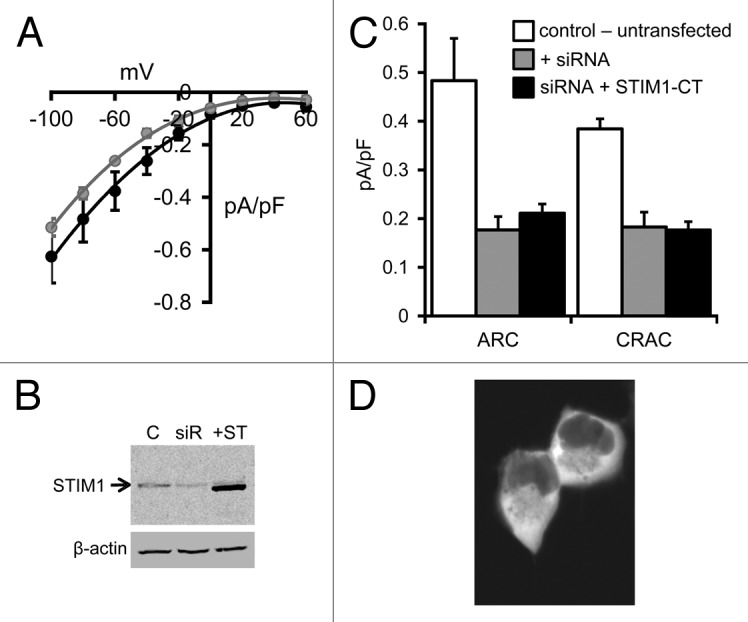
Figure 1. ARC and CRAC channel currents in HEK293 cells expressing the STIM1-CT construct. (A) Mean (± SE) I/V curves for the endogenous AA-activated ARC channels (black) and store-operated CRAC channels (gray) in HEK293 cells. (B) Representative western blot showing STIM1 levels in untransfected cells (C), in the same cells following treatment with a STIM1 siRNA (siR) and in the siRNA-treated cells following expression of the siRNA-resistant STIM1-CT construct (+ST). (C) Mean (± SE) ARC currents and CRAC currents measured at -80 mV in untransfected cells (white columns), in STIM1 siRNA-treated cells (gray columns) and in siRNA-treated cells following expression of the siRNA-resistant STIM1-CT construct (black columns). (D) Representative live confocal image of cells expressing the eGFP-tagged STIM1-CT construct.
