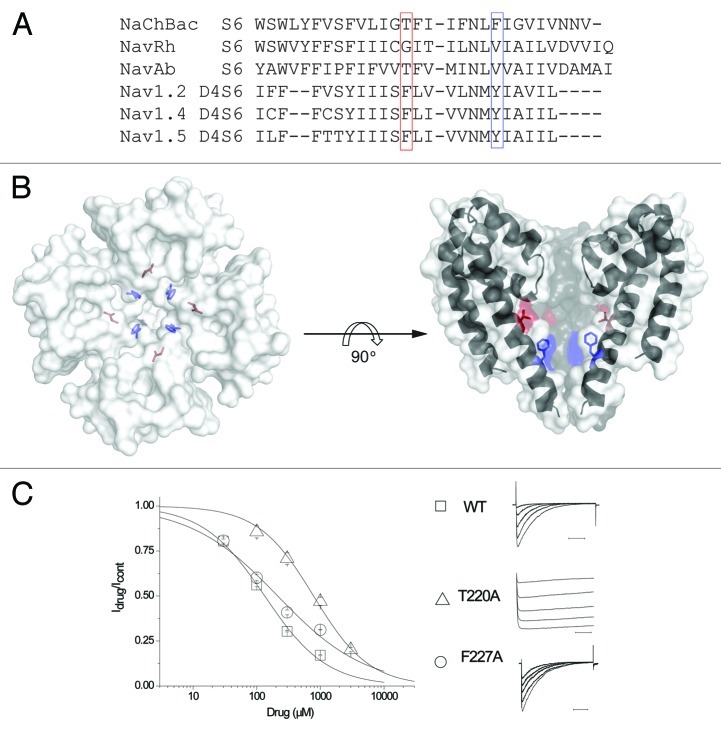
Figure 2. The canonical local anesthetic-binding sites are not conserved in NaChBac. (A) The sequence alignment of S6 of bacterial and eukaryotic S6 segments, highlighting two sites implicated in use-dependent inhibition of eukaryotic channels. (B) Top-down view of the highlighted residues shown on the right. (C) A concentration response curve was generated with the mean of Idrug/Icontrol obtained from the peak currents after exposing cells to 30 μM, 100 μM, 300 μM, 1 mM and 3 mM (for T220A only) lidocaine. The IC50 for lidocaine, according to the concentration response curve, is ~135 μM for WT(), ~788 μM for T220A() and ~214 μM for F227A (). Representative current traces are obtained after depolarization from the holding potential -120 to -20 mV in the presence of various lidocaine concentrations, peak current sizes were reduced upon application of increasing lidocaine concentrations (right).

An official website of the United States government
Here's how you know
Official websites use .gov
A
.gov website belongs to an official
government organization in the United States.
Secure .gov websites use HTTPS
A lock (
) or https:// means you've safely
connected to the .gov website. Share sensitive
information only on official, secure websites.
