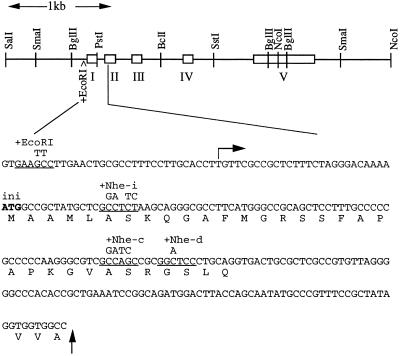
Figure 1.
AtpC gene structure and locations of introduced restriction sites. A schematic representation of the SalI-NcoI AtpC genomic DNA fragment used for transformation is shown at the top, with the sequence between an EcoRI site introduced 55 bp upstream of the initiation codon and the end of the TP-coding region shown below. Open boxes represent the five exons (I–V). The site of transcription initiation is indicated by a horizontal arrow (Yu et al., 1988; Quinn and Merchant, 1995). Stromal processing occurs at the end of the TP, as indicated by the vertical arrow (Yu and Selman, 1988). The initiation codon (ini) is shown in bold. The sites of introduced restriction sites are underlined in the wild-type sequence, with the nucleotide changes shown above. The sequence of the PstI site used for the fusion to the ble-coding region is shown in italics.

