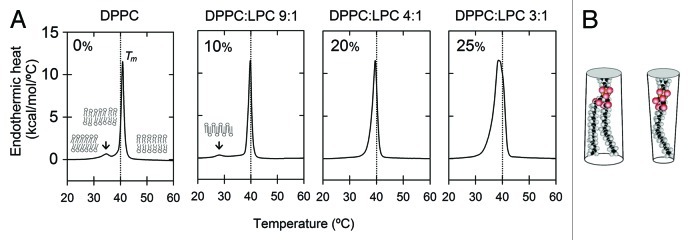
Figure 1. The effect of LPC on the phase transition (change in heat capacity) of DPPC MLVs as measured by differential scanning calorimetry (DSC). (A) DPPC thermograms in the absence (0%) or presence of 10, 20 or 25 mol% LPC at the indicated temperatures. Arrows show the displacement of the pretransition temperature (Tp) which defines the ripple phase (Pβ') in pure DPPC. A new pretransition appears at lower temperatures (probably indicating an interdigitated gel phase, LβI), then it vanishes at high doses of LPC. In (B), the structure factor for cylindrical DPPC (Si = 1.11) and inverted cone-shaped LPC (Si = 0.78) are schematized (Lipid structures taken from ref. 40).

An official website of the United States government
Here's how you know
Official websites use .gov
A
.gov website belongs to an official
government organization in the United States.
Secure .gov websites use HTTPS
A lock (
) or https:// means you've safely
connected to the .gov website. Share sensitive
information only on official, secure websites.
