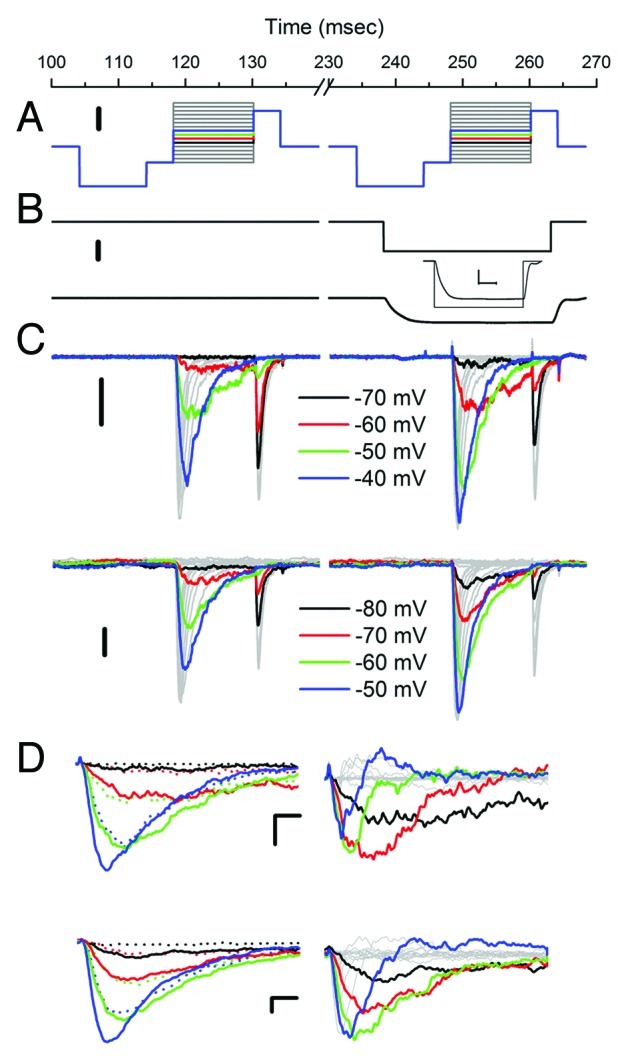
Figure 1. NaV1.5 is reversibly pressure-sensitive in cell-attached and inside-out patches. (A) Voltage-ladder protocol includes a pre-pulse to -200 mV for 10 msec to accelerate recovery from inactivation. Patches are stepped from -140 to +10 mV in 10 mV increments to test activation and then a step to -10 mV to test inactivation. Scale bar is 50 mV. (B) Pressure step to -35 mmHg was applied during the second voltage ladder. Scale bar is 20 mmHg. Lower trace shows pressure at the patch in response to a -30 mmHg step. Inset shows that a -35 mmHg applied pressure results in a -30 mmHg pressure at the patch after a 5 msec risetime. (C) Voltage-dependent currents in a cell-attached (upper) and inside-out patches (lower) at rest (0 mmHg, first ladder) and during pressure stimulation (-30 mmHg, second ladder). Color highlighted steps demonstrate typical differences (larger currents, faster kinetics, greater inactivation) between 0 mmHg and -30 mmHg at multiple voltages spanning the steep voltage-dependent activation. Scale bar is 20 pA for upper trace and 50 pA for lower trace. (D) On the left voltage-dependent currents highlighted in (C) overlaid for 0 mmHg (dotted traces) and -30 mmHg (solid traces) for cell-attached (top) and inside-out (bottom) patches. These traces show larger currents and faster kinetics with pressure. On the right are difference currents Idiff = I-30mmHg – I0mmHg for cell-attached (top) and inside-out (bottom) patches. Pressure-induced changes in the voltage-dependent currents for cell-attached and inside-out patches are very similar. Scale bars 20 pA and 1 msec for cell-attached (upper) traces and 50 pA and 1 msec for inside-out (lower) traces.
