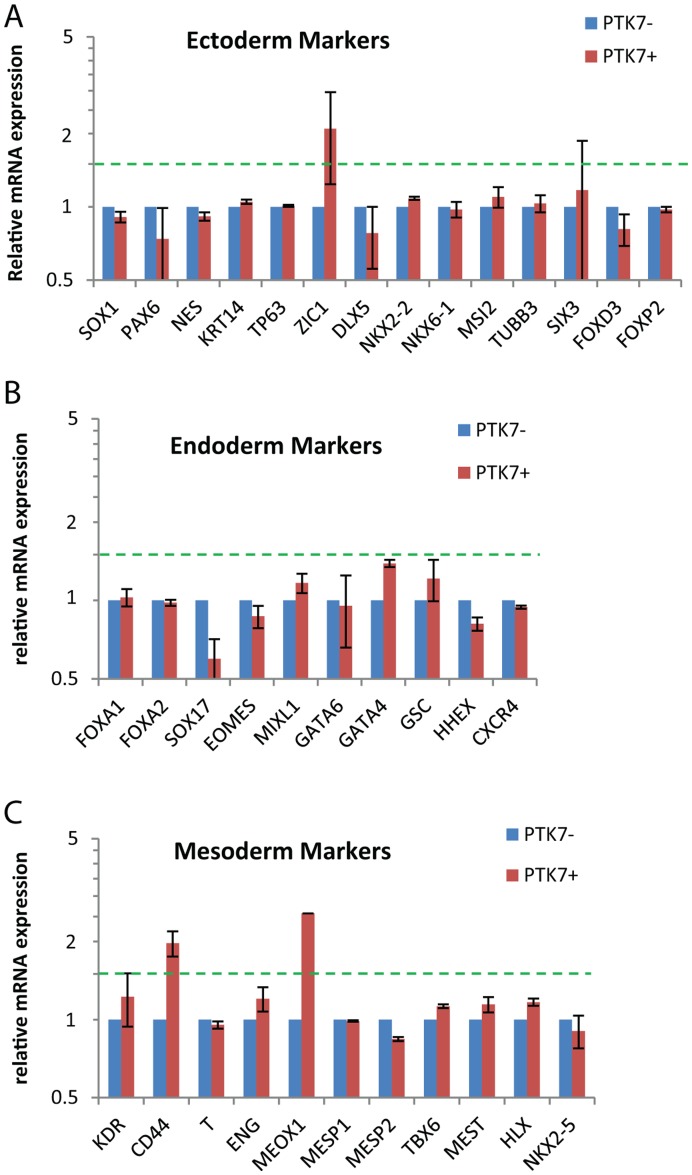
Figure 5. Lineage marker analysis on PTK7− and PTK7+ populations.
Feeder-free H9 and XFiPSC2 (differentiated for 2 days) were sorted into PTK7+ and PTK7− populations. Expression level was determined by microarray analysis as described in Materials and Methods. All samples were normalized to PTK7− from the same sort. Shown are the averages of normalized readings for PTK7+ and PTK7−, with standard errors across two experiments. The relative expression of all samples was analyzed for (A) ectoderm markers, (B) endoderm markers and (C) mesoderm markers.

