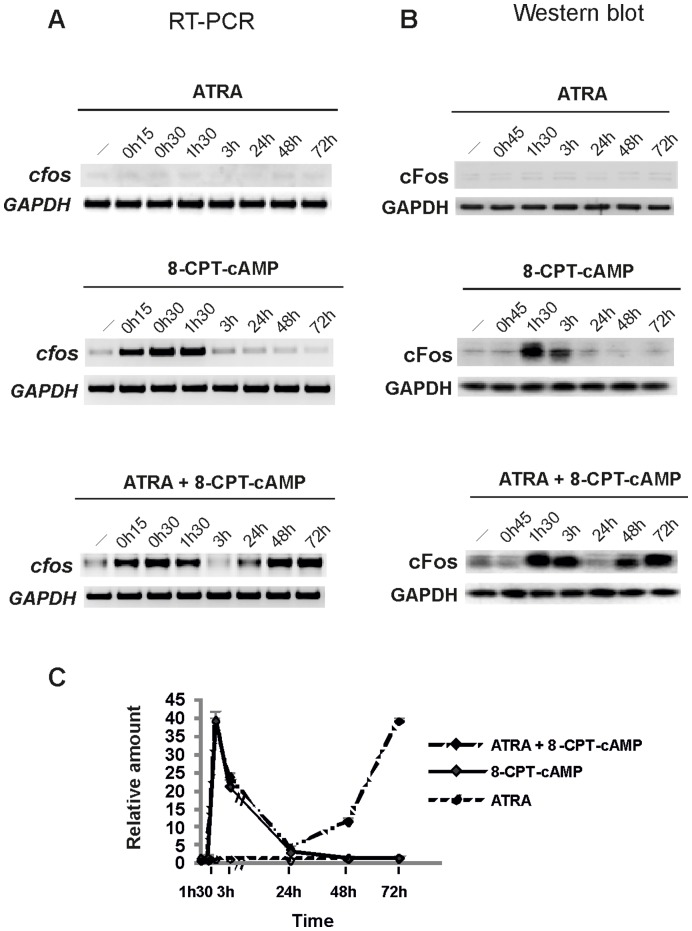
Figure 2. Time course of cFos expression in response to ATRA and 8-CPT-cAMP in NB4-LR1 cells at transcriptional and protein levels.
(A) Representative RT-PCR analysis of cfos mRNAs from NB4-LR1 cells, mocked (−) or treated with ATRA (10−6 M), 8-CPT-cAMP (150 µM) or in combination, as indicated. (B) Western blot analysis of cFos expression. Proteins from total lysates of NB4-LR1 cells, mocked (−) or treated with ATRA and/or cAMP as indicated, were resolved on 10% SDS–polyacrylamide gel electrophoresis (PAGE) and processed for immunoblotting with anti-cFos antibody (Santa Cruz). Glyceraldehyde-3-phosphate dehydrogenase (GAPDH) served as a loading control. (C) Quantitative expression of cFos protein relative to control. Western blot signals were scanned and cFos protein expression levels were quantitated by using FluorChem 8800 Imager. The mean value (± s.d) from at least four independent experiments is indicated. No induction is observed with ATRA, whereas cFos is transiently induced in response to 8-CPT-cAMP. A biphasic expression pattern is observed in response to 8-CPT-cAMP and ATRA, which cooperate to overcome resistance.

