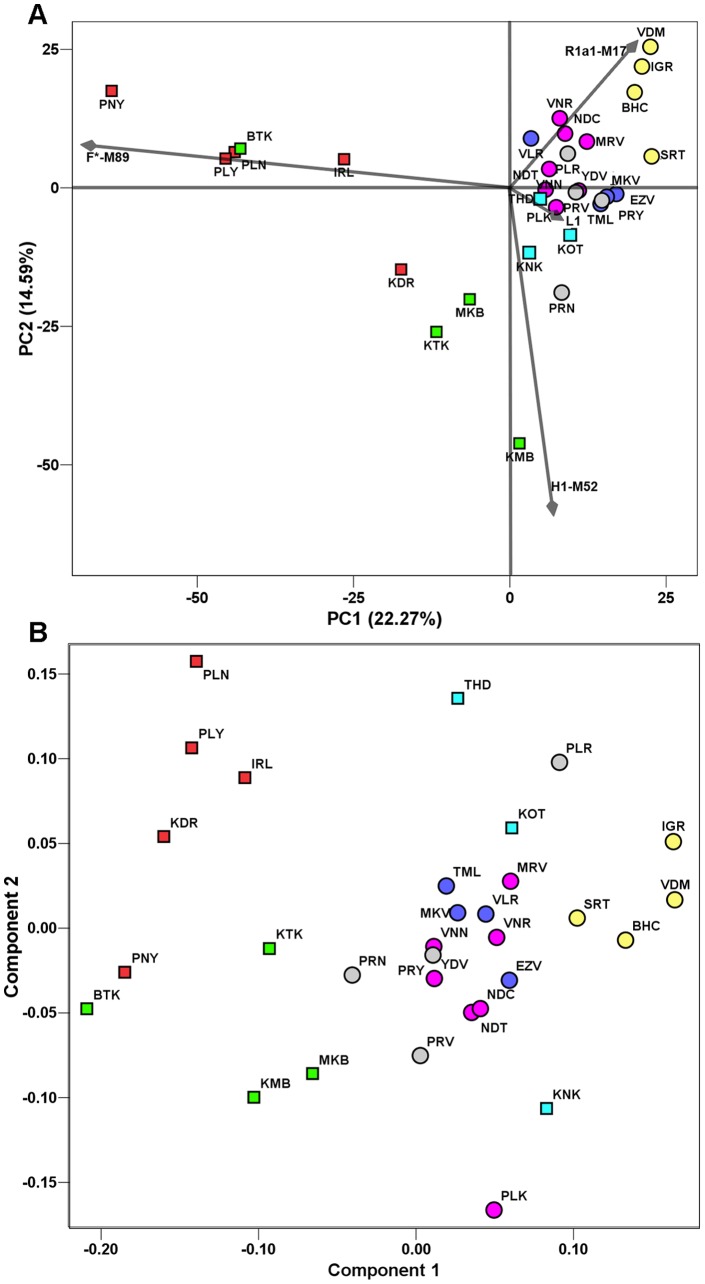
Figure 2. Plots representing the genetic relationships among the 31 tribal and non-tribal populations of Tamil Nadu.
(A) PCA plot based on HG frequencies. The two dimensions display 36% of the total variance. The contribution of the first four HGs is superimposed as grey component loading vectors: the HTF populations clustered in the direction of the F-M89 vector, HTK in the H1-M52 vector, BRH in the R1a1-M17 vector, while the HG L1-M27 is less significant in discriminating populations. (B) MDS plot based on 17 microsatellite loci Rst distances. The two tribal groups (HTF and HTK) are clustered at the left side of the plot while BRH form a distant cluster at the opposite side. The colors and symbols are the same as shown in Figure 1, while population abbreviations are as shown in Table 1.

