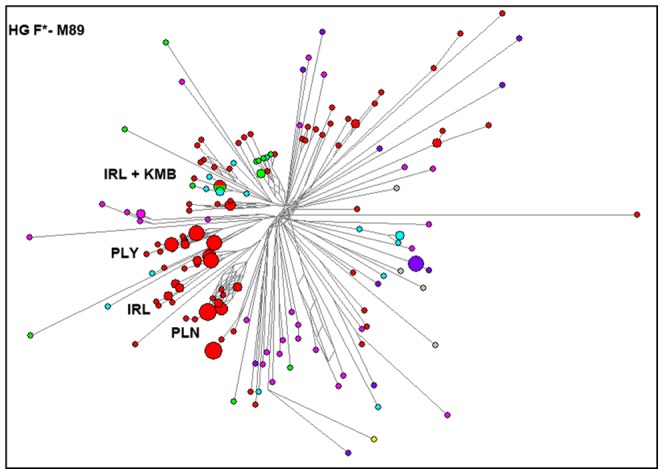
Figure 3. Reduced median network of 17 microsatellite haplotypes within haplogroup F-M89.

The network depicts clear isolated evolution among HTF populations with a few shared haplotypes between Kurumba (HTK) and Irula (HTF) populations. Circles are colored based on the 7 Major Population Groups as shown in Figure 1, and the area is proportional to the frequency of the sampled haplotypes. Branch lengths between circles are proportional to the number of mutations separating haplotypes.
