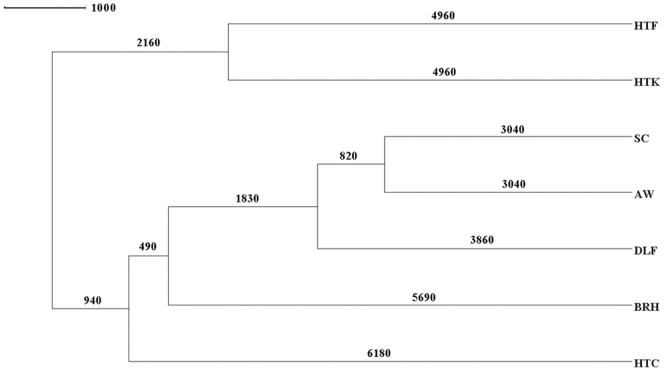
Figure 4. Modal tree obtained by BATWING indicating the coalescence time divergence estimates (in years) among Major Populations Groups (MPG) after using 17 STRs from all haplogroups.
BATWING estimates suggest that all populations groups started to diverge 7.1 Kya (95% CI: 5.5–9.2 Kya), with limited admixture among them for the last 3.0 Kya (2.3–4.3 Kya), the youngest diverge time estimate. The modal tree shows two differentiated nodes with clear overlapping estimates of the splits: a first node including one of the tribal groups (HTC) together with all the non-tribal MPGs (castes) with a divergence time of 6.2 Kya (4.7–8.0 Kya), while the second node embraces the HTF and HTK tribal groups with an estimated divergence between then of 4.9 Kya (3.6–7.1 Kya).

