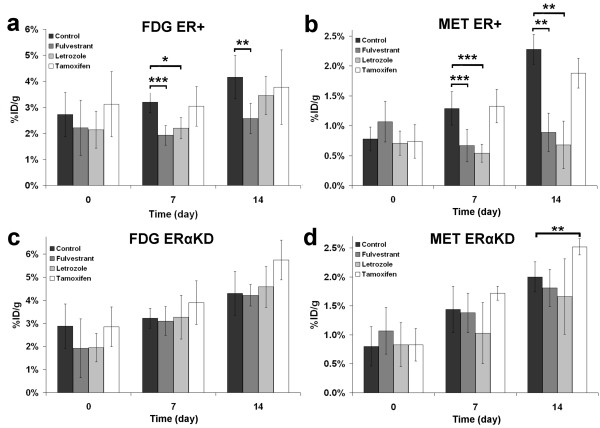
Figure 7.
Comparison of %ID/g uptake in the control group and the three treatment groups. Uptake was compared for ER+ tumors imaged with FDG (a) and [11C]-MET (b) and for ERαKD tumors imaged by PET with FDG (c) and [11C]-MET (d). Asterisk denotes p < 0.05; double asterisk, p < 0.01; and triple asterisk, p < 0.005.

