
Figure 4.
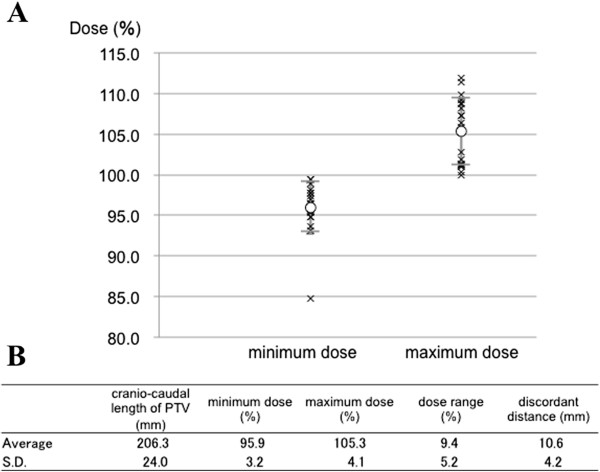
Results of average and standard deviation with D-SLIT. (A) Distributions of minimum dose and maximum dose in all 20 cases. Each cross symbol shows the dose in each case. Open symbols represent average doses. (B) Average and standard deviation with D-SLIT.