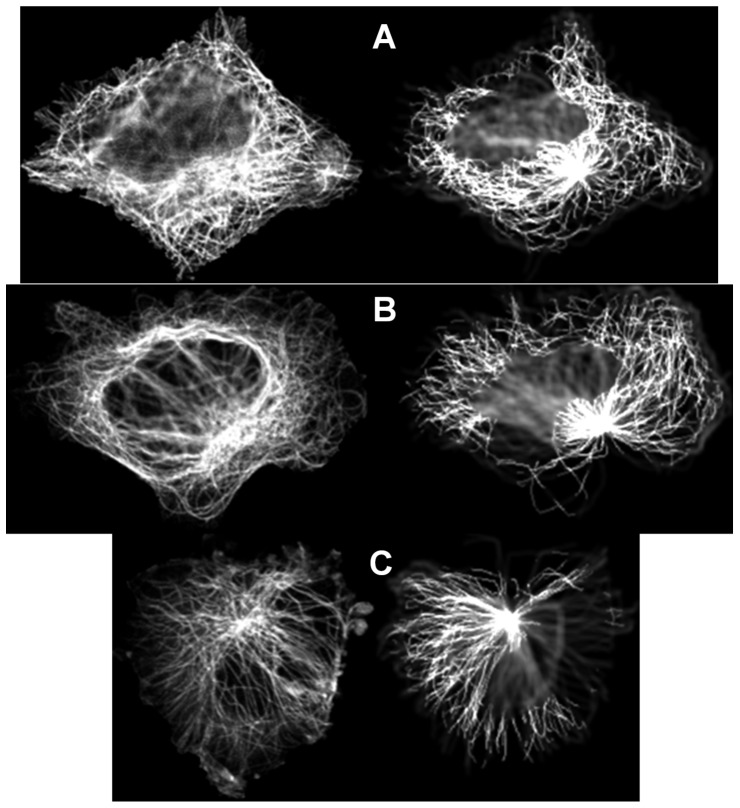
Figure 4. Examples for estimating parameters values by matching to simulated images.
2D real images are shown on the left, and center slices of the best-matching 3D synthetic images are shown on the right. (A) A-431 cell line, Number of microtubules = 250, Mean of length distribution = 30 microns, Collinearity = 0.97000; (B) U-2OS cell line, Number of microtubules = 250, Mean of length distribution = 30 microns, Collinearity = 0.98466; (C) U-251MG cell line, Number of microtubules = 250, Mean of length distribution = 20 microns, Collinearity = 0.99610.

