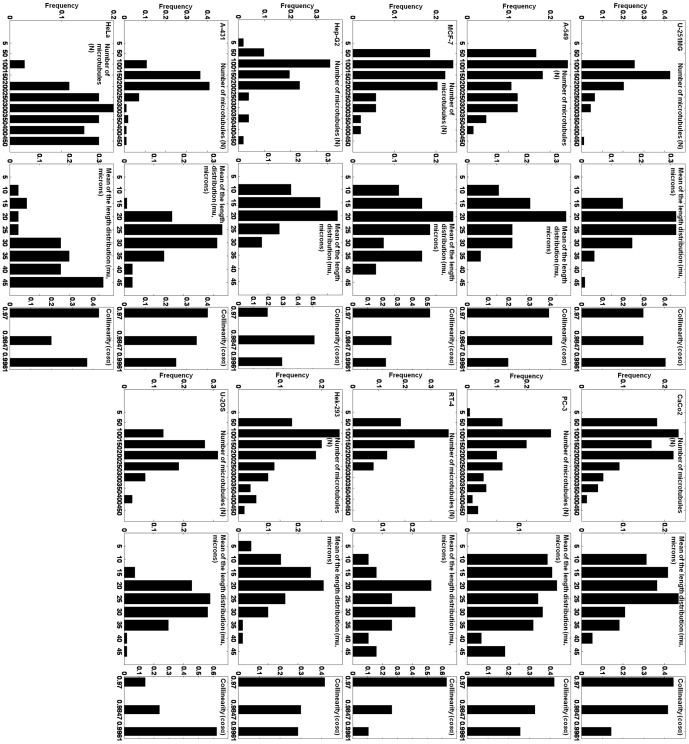
Figure 5. Frequency distributions of all estimated parameters from real 2D images for all cell lines.
There are two sets of three columns for the model parameters (number of microtubules, mean of the length distribution and collinearity) in each row. The cell lines (from top to bottom) are U-251MG, A-549, MCF-7, Hep-G2, A-431 and HeLa in the left column, and CaCo2, PC-3, RT-4, Hek-293, and U-20S in the right.

