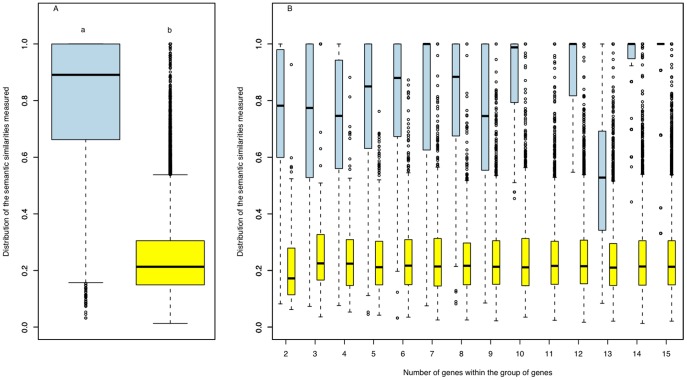
Figure 4. Distribution of semantic similarities.
(A) Distribution of GO biological process semantic similarities in duplicated gene groups (blue) vs. randomly-selected gene groups (yellow). Means with a different letter are significantly different according to Student’s R t-tests at p<0.05. (B) Details of the same distribution with groups pooled by size. The mean of each duplicated group is significantly different from the mean of each randomly-selected genes group (p<0.05). Note: no data were available for the group with 11 genes.

