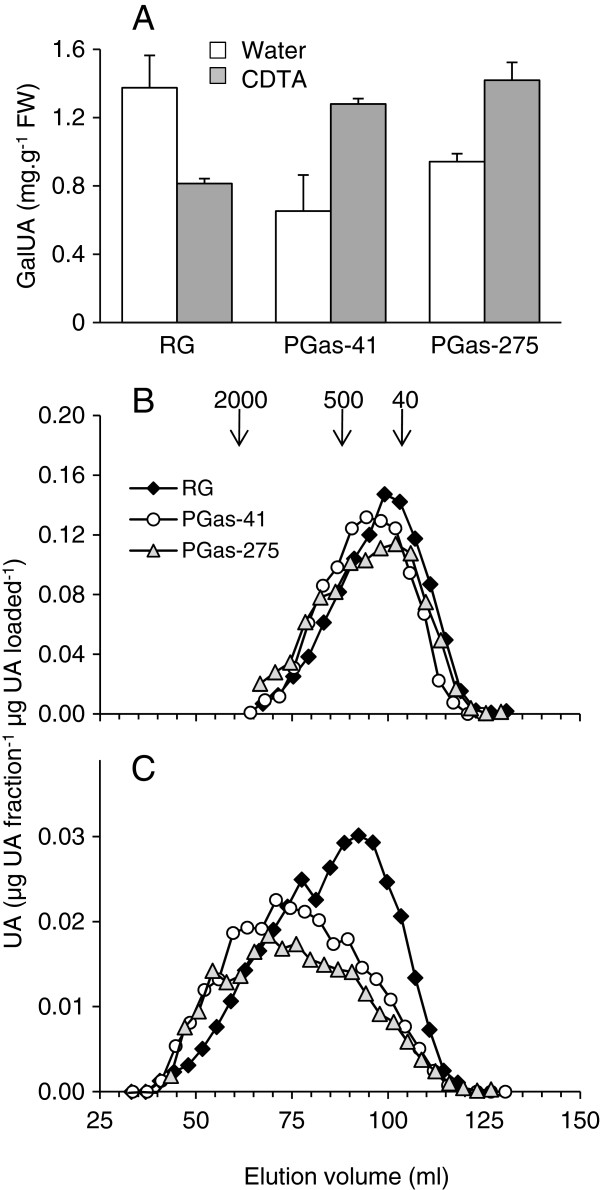
Figure 3.
Polyuronide content and size distribution of water-soluble and CDTA-soluble polyuronides from the cell walls of transgenic PG1as and ‘Royal Gala’ (RG) control apple fruit after ripening for 16 weeks at 5°C.A) Polyuronide content, expressed as mg of uronic acid per g fresh weight of tissue, of water-soluble extracts (white bars) and CDTA-soluble extracts (grey bars) (n = 3 ± Standard Deviation). B) Size distribution of water-soluble polyuronides, and (C) CDTA-soluble polyuronides after elution on Sepharose CL-2B (profiles are typical examples from two extractions). Arrows indicate elution of dextran molecular weight markers (kDa).

