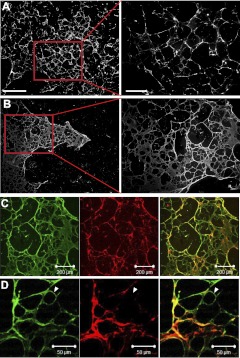
Figure 3.
Decellularized ECFC matrices. A, B) Collagen IV (A) and fibronectin (B) production by ECFCs after 4 d. Red outline delineates magnified right panel. Scale bars = 100 μm (left panels); 500 μm (right panels). C, D) Confocal microscopy images of fibronectin (green) and collagen IV (red) matrix produced by ECFCs after 4 d. White arrowheads indicate an area in the ECM made up of only fibronectin.

