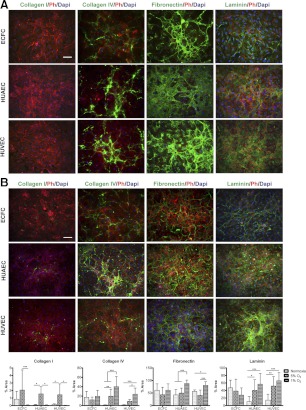
Figure 5.
Regulation of ECM production by oxygen tension. Effect of 1% O2 (A) and 5% O2 (B) on ECM protein expression from ECFCs, HUAECs, and HUVECs. Ph, phalloidin. Scale bar = 100 μm. C) Quantification of percentage area coverage of ECM deposition from tested conditions. *P < 0.05, **P < 0.01, ***P < 0.001.

