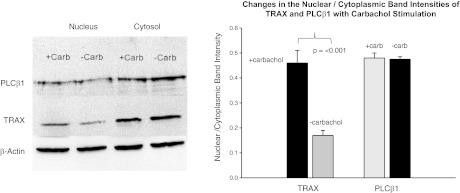
Figure 2.
Movement of TRAX to the nucleus with cell stimulation. Left panel: Western blot results of nuclear and cytosolic fractions of TRAX and PLCβ1 from HEK293 cells untreated or treated with 1μM carbachol and incubated for 5 min before lysing and fractionating. Treatment for 30 min gave identical results. Image is a composite of 4 independent experiments and was carried out by digitizing the band density and normalizing each band to actin loading controls. Right panel: comparison of the nuclear/cytosolic intensity of cells (see Materials and Methods) stained with Alexa488 anti-TRAX monoclonal (Santa Cruz Biotechnology) for 46–58 cells before and 5 min after carbachol stimulation.

