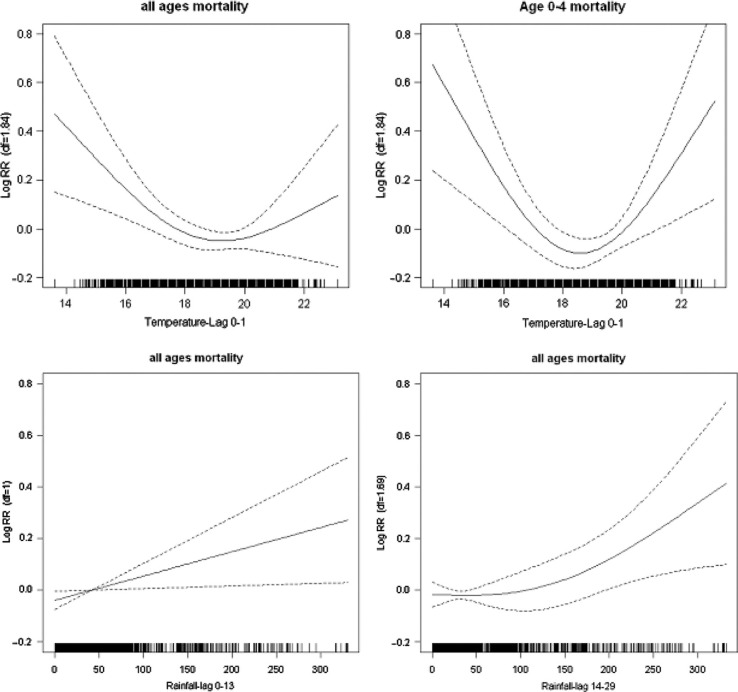
Fig. 3.
Smooth functions of temperature for all and under-five mortality, and rainfall for all ages allowing lags of 0–13 days and 14–29 days. The vertical axes show the log (relative risk) and the horizontal axis show the scale of the explanatory variable. Confidence intervals (95%) are shown as dotted lines.

