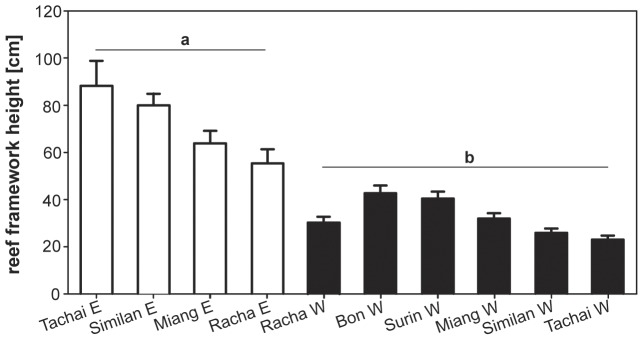
Figure 2. Reef framework height above bottom.
Reef framework height (mean ± SE) measured at all study sites. Open bars are E sites (a), black bars W sites (b), showing significant differences (Welch's t-test: t = 10.66, df = 131, p<0.001). Framework height is arranged from left to right with lowest to strongest LAIW (large amplitude internal waves) intensity (intensities were estimated for sites where no temperature record were available (Tachai E, Racha E)).

