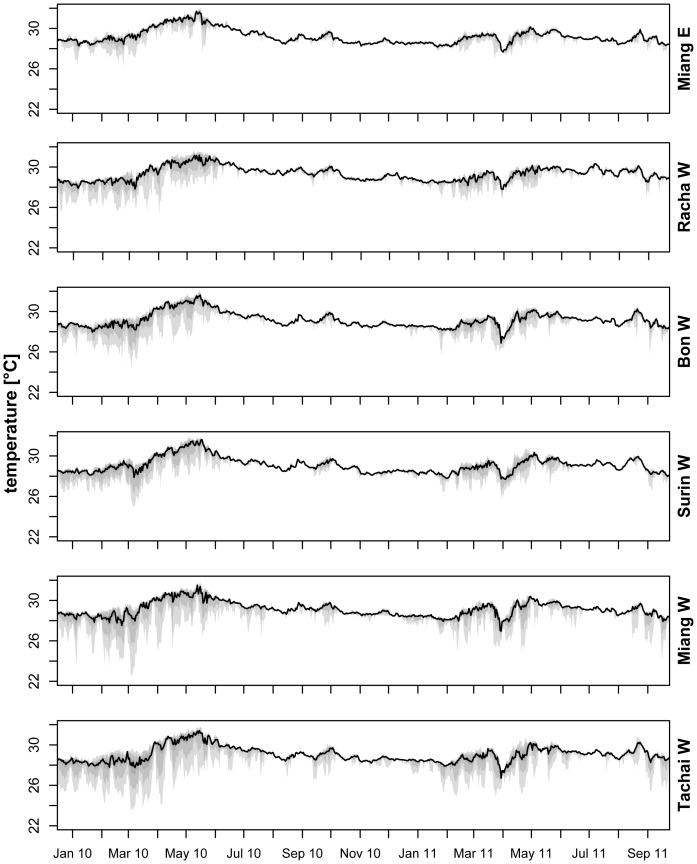
Figure 3. Sea bed temperature at 15 m.
Temperature record for the 6 core sampling sites (cf. Fig. 1) showing median (black lines) and quantil ranges in shades of grey (light gray: 0–1, intermediate gray: 0.05–0.95 and dark grey: 0.25–0.75). Sites are arranged from top to bottom (Miang E, Racha W, Bon W, Surin W, Miang W and Tachai W) with lowest to strongest LAIW (large amplitude internal waves) intensity.

