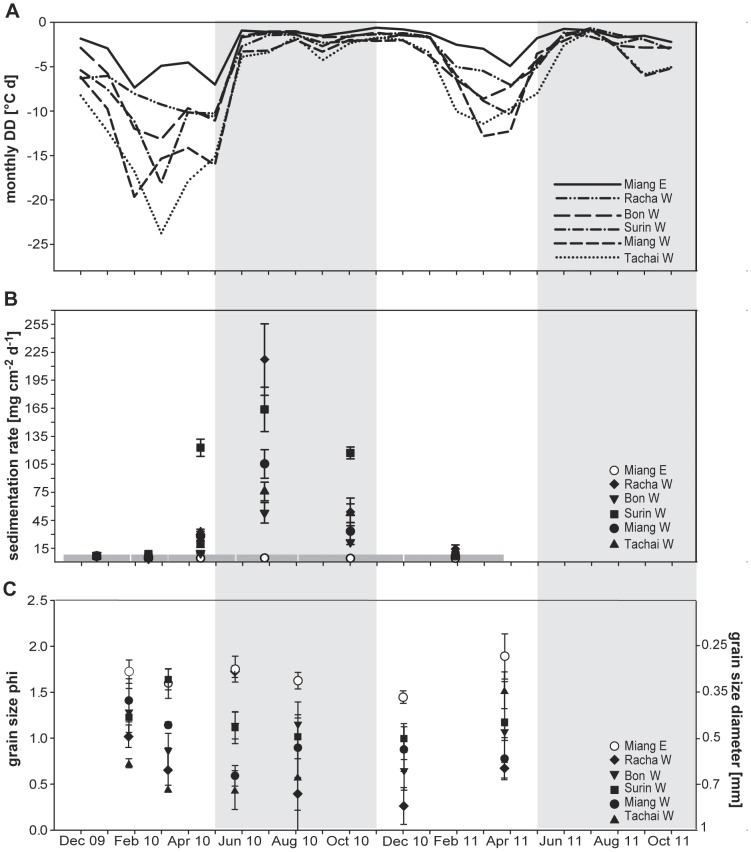
Figure 4. Negative temperature anomaly, sedimentation rate and grain size variation.
All parameters are displayed for the study period November 2009 to December 2011 for the core sampling sites (cf. Fig. 1). A) Negative temperature anomalies calculated as cumulative degree days (DD) per month. B) Temporal evolution of sedimentation rates (mean ± SE) as dry sediment mass per cm2. Deployment periods are indicated by the grey broken line parallel to the time axis. C) Grain size phi (mean ± SE) or diameter (mean ± SE [mm]). Grey shaded area corresponds to the SW-monsoon season May-November.

