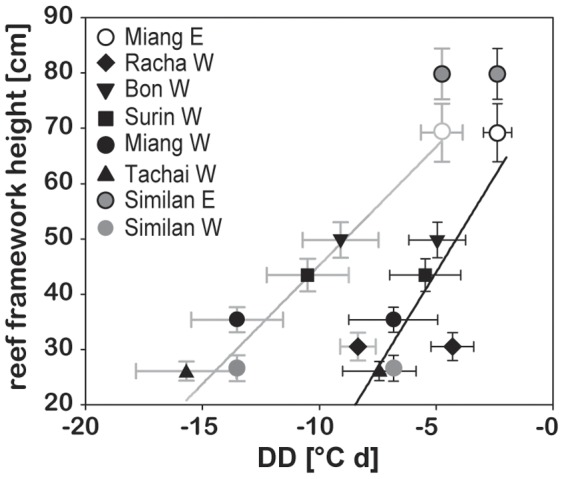
Figure 6. Reef framework height versus 2010 and 2011 dry season negative temperature anomaly.

Reef framework height plotted as a function of dry season temperature anomaly (DD = degree days) reflecting the negative temperature anomalies experienced during the peak large amplitude internal waves (LAIW) period for 2010 (grey error bars and regression line) and 2011 (black error bars and regression line) for core sampling sites (cf. Fig. 1) plus Similan E and W (temperature anomaly values were set equal to Miang E and W, respectively; justification see Schmidt et al. [16]). All values are given as mean ± SE.
