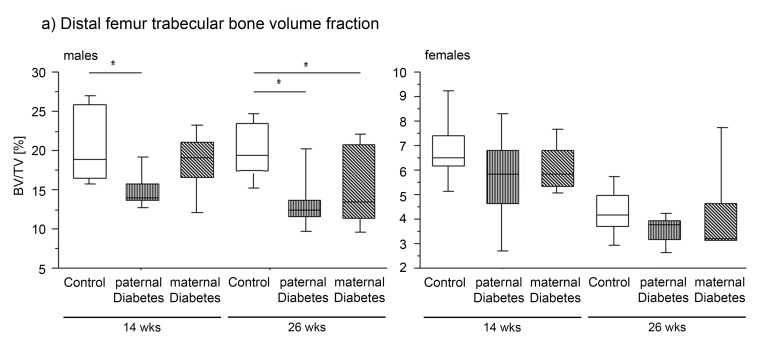
Figure 4. Percent of distal femur Bone Volume/Trabecular Volume (Tb.BV/TV (%)).
Boxplots showing the smallest observation (lower bar), lower and upper quartile (box), median (line in box) and largest observation (upper bar) of male (left) and female (right) offspring of controls (open bars), paternal diabetes (longitudinal shading) and maternal diabetes (diagonal shading) for Percent of distal femur Bone Volume/Trabecular Volume (BV/TV %) at 14 and 26 weeks of age. * indicates p<0.05 vs. control.

