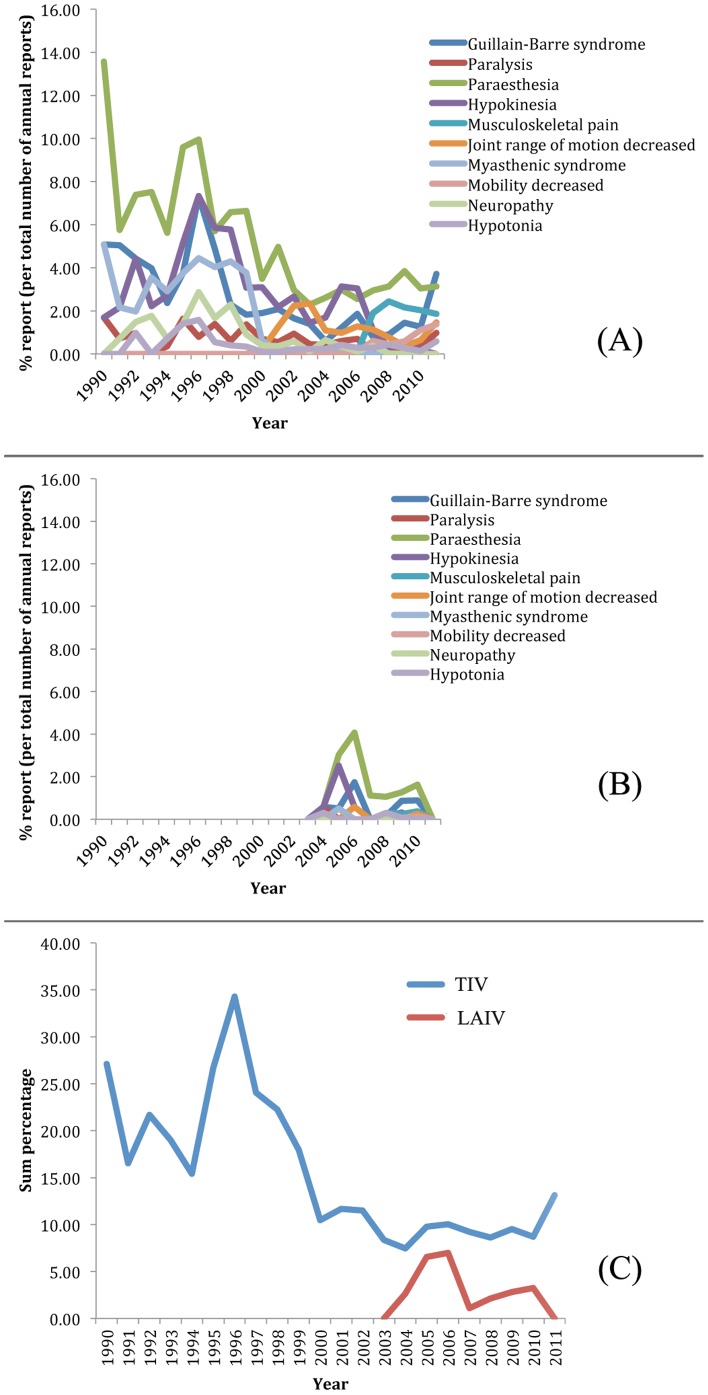
Figure 5. Comparison of yearly report distributions of GBS and GBS-related adverse events associated with TIV and LAIV.
LAIV was recently released and therefore data available are from 2003 onward. The raw number of occurrences was scaled to percentages by the number of reports in each year. The percentages of yearly case reports of GBS and other GBS-related symptoms associated with TIV and LAIV are displayed in (A) and (B), respectively. The combined percentages of GBS and related AEs associated with TIV and LAIV are depicted in (C).

