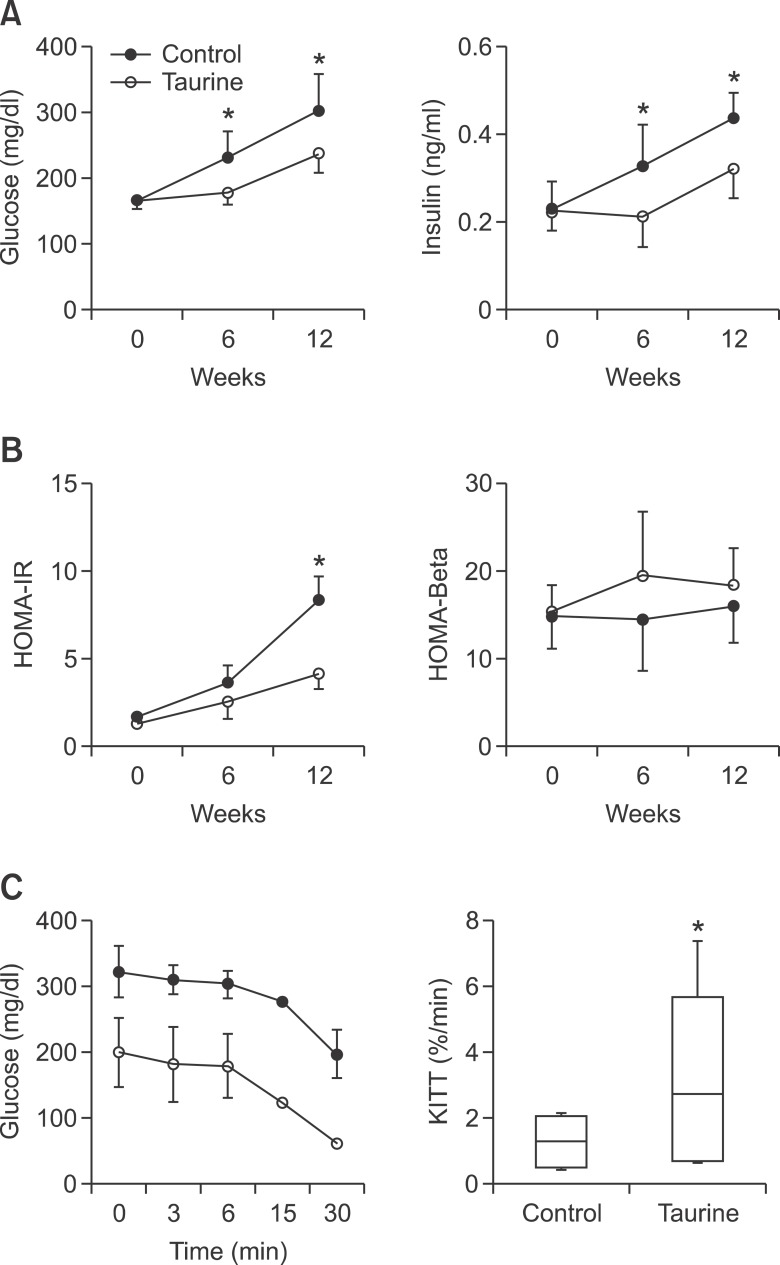
Figure 3.
The effects of taurine supplementation on insulin resistance (HOMA-IR) and beta cell function (HOMA-β) in OLETF rats. (A) Levels of glucose and insulin 0, 6, and 12 weeks after beginning the taurine-supplemented diet. (B) Comparison of HOMA-IR and HOMA-β between taurine and the control groups. (C) Comparison of Insulin Tolerance Test (ITT) between two groups. Between-group differences were compared using the Mann-Whitney U test. Differences were considered statistically significant at P < 0.05. *P < 0.05; NS, not significant.

