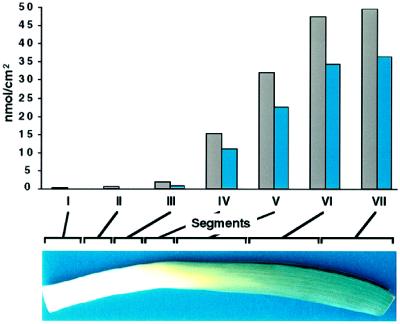
Figure 1.
Accumulation of total wax (gray bars) and hentriacontan-16-one (blue bars) from segments (I–VII) of a single leaf. The leaf segments are indicated by brackets along the top of the leaf pictured below the graph. The brackets are proportional to the segment distance as described in Methods. Data from a representative sample are shown, and the segment with ≥ 2 nmol/cm2 of hentriacontan-16-one was segment III. This experiment was carried out six times. In different leaf samples the maximum levels of total wax and hentriacontan-16-one ranged from 50 to 68 and 27 to 60 nmol/cm2, respectively.

