Figure 4.
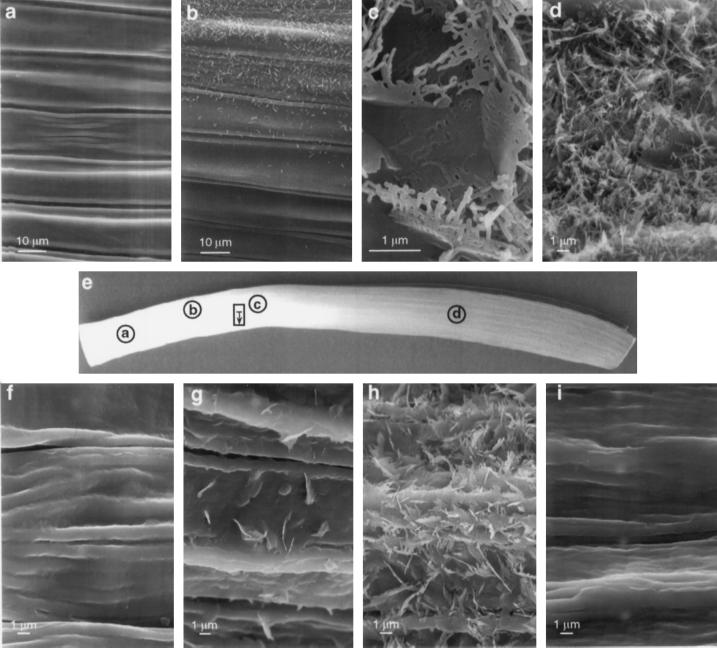
Scanning electron micrographs of the abaxial surface of a leek leaf. a, Region below the onset of wax accumulation, where no hentriacontan-16-one was detected by GC-MS and no wax crystals were observed. b, Region within the segment showing the onset of wax accumulation as determined by the presence of hentriacontan-16-one ≥ 2 nmol/cm2. c, Waffle-like structures of wax crystals were observed below the onset of wax accumulation. d, Region well above the onset of wax accumulation showing numerous branched rods and plates. e, Photograph of a leek leaf showing the abaxial surface. All electron micrographs are shown in the same orientation as the pictured leaf. Circles indicate areas examined for a through d, and the rectangle indicates the area examined for f through i. The unidirectional arrow within the rectangle indicates the latitudinal survey covered between 10.5 and 11.5 cm above the leaf base, which was identified as below the onset of wax accumulation by GC-MS analysis on this leaf. Areas shown in f through i were taken along the same lateral line as illustrated in the rectangle, showing the uneven deposition of crystals in adjacent regions below the segment identified as the onset of wax accumulation. a and b are from the third leaf of one plant, and c through i are from the third leaf of a second plant.

