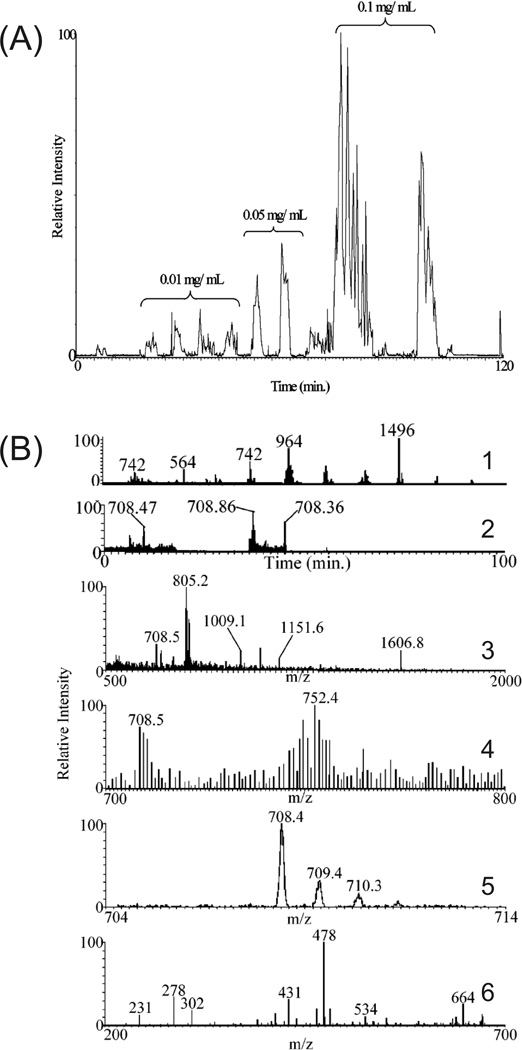
Figure 2.
(A) (CE-MS/MS)n of increasing sample concentrations on a digested six protein mixture. Low abundance peptides are IDed in the most concentrated sample using an m/z exclusion list of high abundance peptides previously selected for MS/MS in the lower concentration samples. (B) Narrow mass range (CE-MS/MS)n analysis of the same protein mixture. (1) CE-MS/MS run with a full scan range (500–2000 m/z) followed by successive narrow mass range scans (100 µm/z). (2) CE-MS/MS electropherogram from (1) displaying only the 700–800 m/z range. Mass spectra of the 708.47 (3) and 708.86 peaks (4) from (2). The 708.86 peptide is present in (3), but its relative intensity was too low to be selected for MS/MS. The 708.86 peptide is easily detected in (4), with an expanded view in (5), from the 700–800 m/z scan and selected for MS/MS, resulting in a database-searchable peptide fragmentation pattern shown in (6). (Reprinted from ref. [52] with permission. © 2006 American Chemical Society.)

