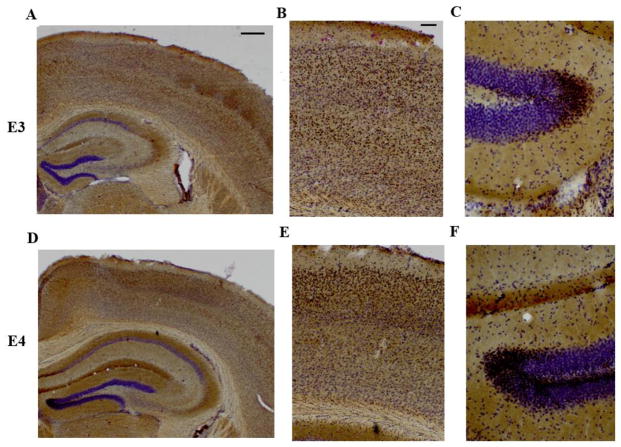
Figure 2. Glutaminase regional distribution is similar in the APOE-ε4 and APOE-ε3 TR mice.
6 month old APOE TR mouse brain sections (50 microns thick) were stained and processed via peroxidase immunohistochemistry for glutaminase staining and cresyl violet counter-staining. (A–C) APOE3 TR representative image and (D–F) APOE4 TR representative image (A, D). Image at 2X magnification, scale bar to 500 microns. (B, E) Cortical image and (C, F) Hippocampal image of the dentate gyrus at 20x magnification. Scale bar set to 100 microns.

