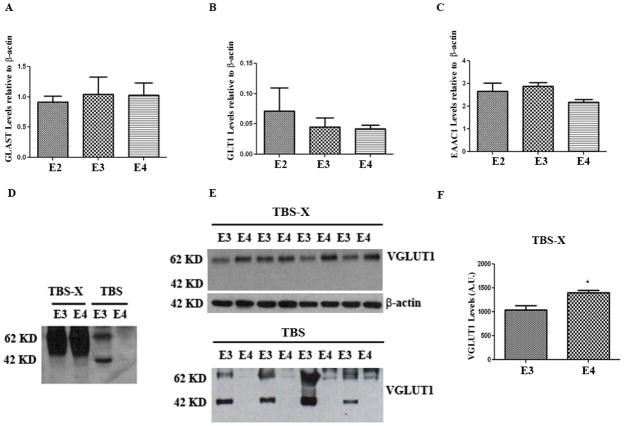
Figure 3. VGLUT1 levels are higher in the TBSX fraction of APOE-ε4 TR mice.
4–5 month old APOE TR mouse brains were homogenized by RIPA and the levels of (A) GLAST, (B) GLT1, and (C) EAAC1 were analyzed by western blot and quantified. These levels were unchanged among the genotypes. (D–F) 4–5 month old APOE TR mouse brains were homogenized by TBS followed by TBS-X via sequential fractionation. (D) VGLUT1 is predominantly in the TBS-X fraction as seen in the representative immunoblot. (E) The immunboblot for VGLUT1 in the TBS-X fraction (top) and TBS fraction (bottom). (F) Quantification for the TBS-X fraction in (E). *, p<0.05. n=4 animals/condition. Error bars expressed as S.E.M.

