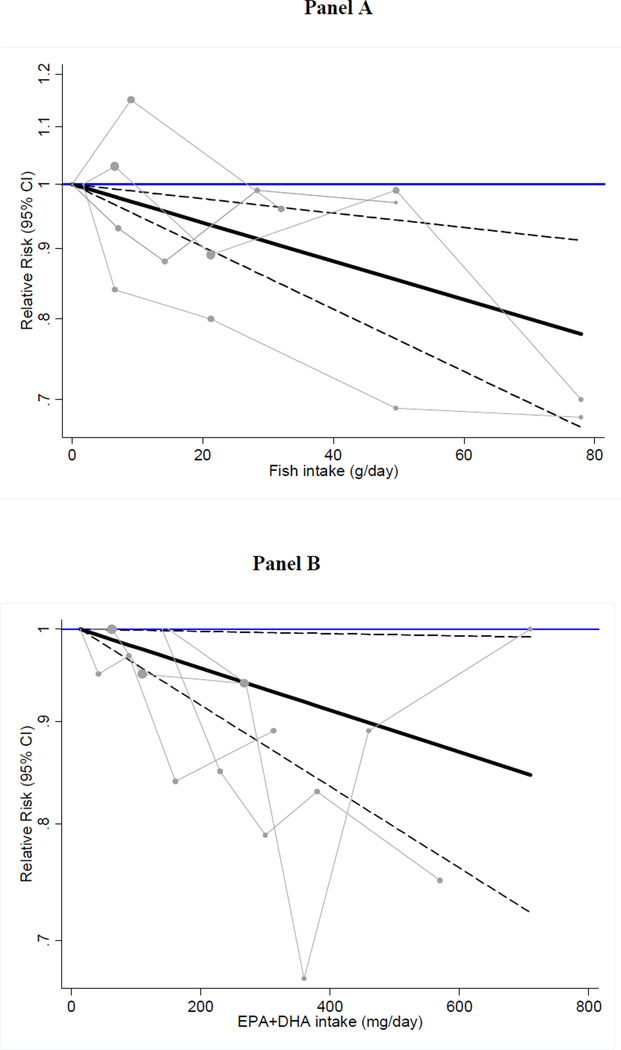
Figure 4.
Dose-response association of fish intake (Panel A) and dietary EPA+DHA with the risk of heart failure using random effects GLST analysis.
Pooled relative risks (solid black lines) and 95% confidence intervals (dashed lines) at each quantity of intake are reported. Gray lines connect study-specific relative risk according to fish or EPA/DHA levels. Vertical axis is on a log scale represents relative risk. The median intake in the lowest category of fish (0 g/d) and EPA+DHA (14 mg/d) were used as reference groups to estimate the pooled relative risks of the higher levels.

