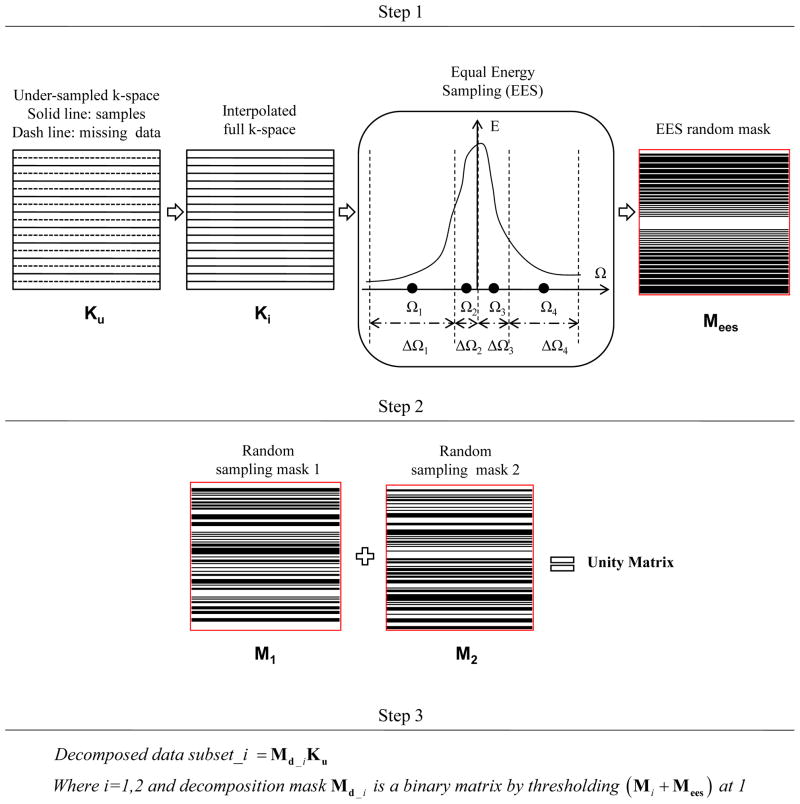
Fig. 1.
Flowchart of sampling decomposition method. Step 1 is to create the EES random sampling mask from the linearly interpolated k-space data. Step 2 is to create two random masks (Nd = 2). In step 3, the decomposition random masks are created from both EES mask and random mask and then used to decompose the original data set into two data subsets.

