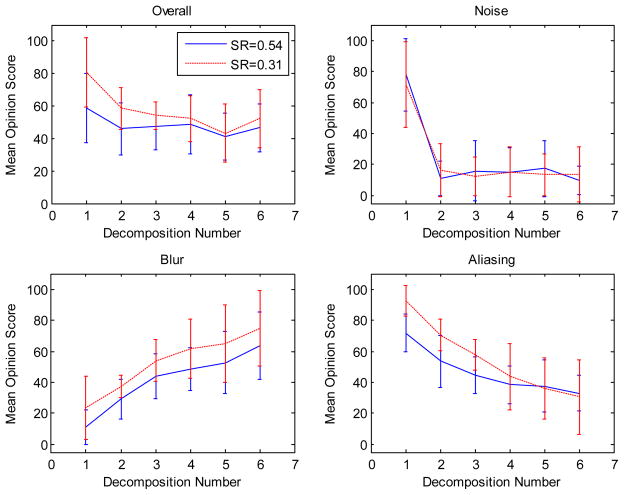
Fig. 4.
Plots show summary of human subject ratings of overall, noise, blur, and aliasing image qualities, with 0 and 100 representing the best and the worst respectively, for test images generated by different sampling ratios (0.3 and 0.5) and decomposition numbers (Nd). The inter-subject standard deviations were calculated and are shown as error bars on the plots. When Nd increases, overall, noise and aliasing ratings improved, but blur ratings worsened.

