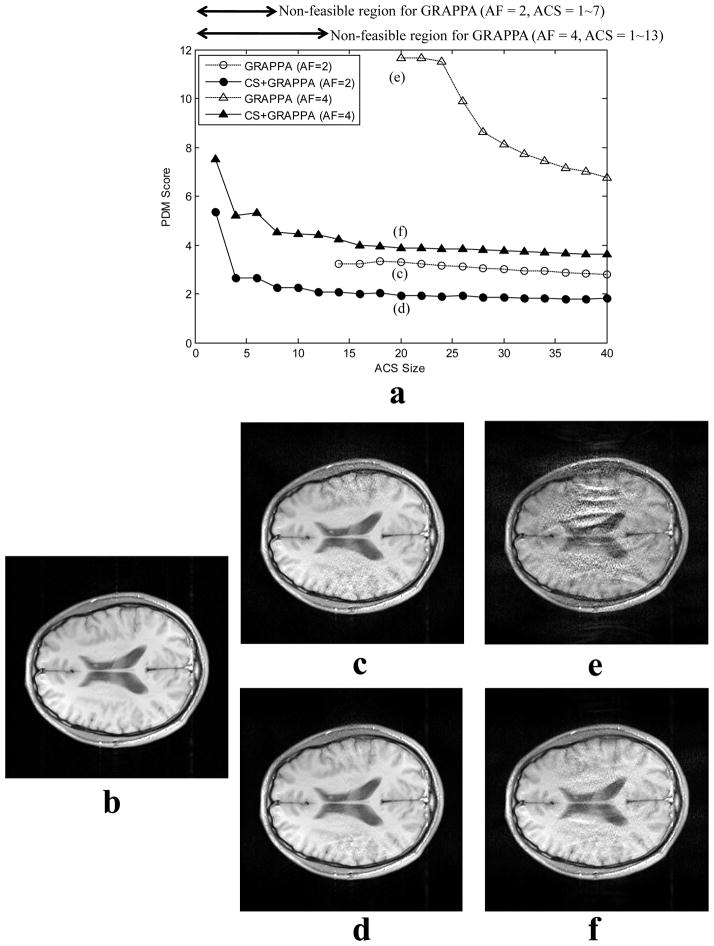
Fig. 6.
Algorithm comparison for 4-channel brain data set. In plot (a), circles represent under-sampled data by ORF of 2 and triangles represent under-sampled data by ORF of 4. Open and solid marks represent standard GRAPPA and CS+GRAPPA (Nd=2) reconstructions, respectively. Plot (a) shows the relationship between image quality (in terms of PDM score) and different ACS size. CS+GRAPPA significantly improves the image quality (by an average of 1.7 times and 2.3 times for the ORF’s of 2 and 4), and is able to work with small ACS size, which is not feasible for the standard method. (b) is a reference image. At ORF=2 and ACS=20, image (c) was reconstructed by GRAPPA, and (d) was reconstructed by CS+GRAPPA. Noise is better removed by CS+GRAPPA. At ORF=4 and ACS=20, image (e) was reconstructed by GRAPPA, and image (f) was reconstructed by CS+GRAPPA. Both noise and aliasing artifacts are significantly more reduced by CS+GRAPPA. Image (f) has a comparable image quality to image (c). However, (f) was reconstructed by CS+GRAPPA from roughly half number of samples used by GRAPPA.

