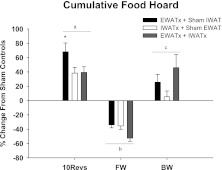
Fig. 7.
Percent change in cumulative food hoard from sham EWATx + sham IWATx for each lipectomy condition (see Fig. 1 legend) in groups 10Revs, FW, and BW. *P < 0.05 compared with IWATx and EWATx + IWATx. aP < 0.05 compared with FW and BW. bP < 0.05 compared with 10Revs and BW. cP < 0.05 compared with 10Revs and FW. Cumulative food hoard of sham EWATx + sham IWATx in 10Revs (96 ± 6), FW (23 ± 1), and BW (11 ± 1) groups is given. Values are means ± SE.

