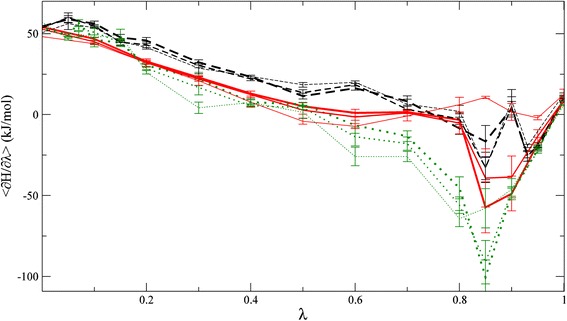
Fig. 5.

Time evolution of free energy profiles. Free energy profiles for forward (black dashed lines), inverted reverse (dotted green lines) thermodynamic integration, and Hamiltonian replica exchange (red solid lines) simulations of the mutation process in absence of PPD (Mut). The thickness of the curves represents simulation length (thin 200, intermediate 600, thick 1,000 ps/λ point)
