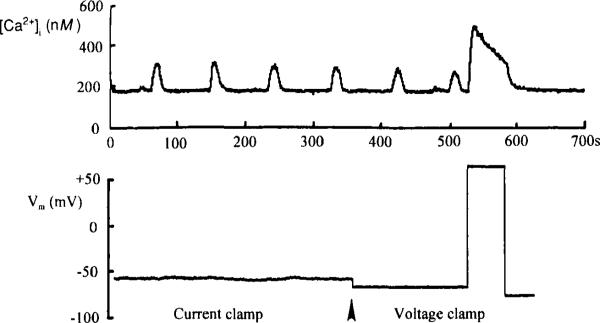
Simultaneous records of intracellular calcium and membrane potential from a rat pancreatic β cell. The cell was loaded with 1 μ
M fura-2/AM at 37°C for 30 min. The cell was excited at 350 nm and 380 nm and the emitted light was collected at 510 nm using an lonoptix imaging system. Intracellular [Ca
2+] was calculated from
where
Kd = 224 n
M, the dissociation constant of fura-2 for Ca
2+; β = ratio of free/bound fura-2 fluorescences at 380 nm;
R = ratio of 350/380 nm fluorescences measured;
Rmin = ratio of 350/380 fluorescences in Ca
2+-free solution; and
Rmax = ratio of 350/380 fluorescences in saturating [Ca
2+]. (
Top) Intracellular [Ca
2+]. Oscillations of [Ca
2+] can be seen with the cell bathed in saline containing 7.5 m
M glucose, with no other form of stimulation. (
Bottom) The record of membrane potential obtained with the perforated patch technique. Initially the cell was under current clamp with a resting potential near −60 mV. At the point marked by the arrowhead, the cell was switched to voltage clamp and held at −70 mV. The oscillations of intracellular [Ca
2+] can be seen to occur without membrane depolarization and continue with the cell held at −70 mV. After two elevations of intracellular [Ca
2+], a depolarizing voltage step was applied to activate voltage dependent Ca
2+ channels and the cell responded with a large increase of intracellular [Ca
2+].