Fig 3.
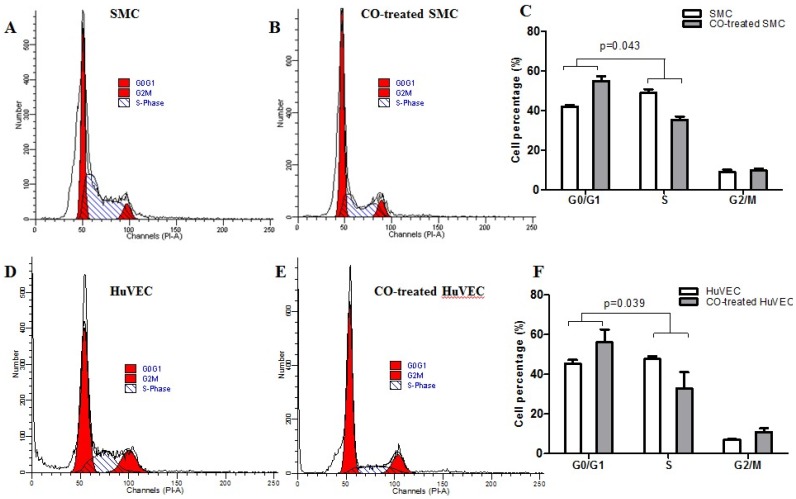
SMC and HuVEC cell cycle detection during CO exposure by flow cytometry. After SMC and HuVEC were exposed to 250 ppm of CO for 6 h, cell percentage was analyzed in different cell cycle phase on SMC and HuVEC in the presence and absence of CO. (A) Representative flow cytometric analysis on SMC in G0/G1, S and G2/M phase in normal culture condition. (B) Representative flow cytometric analysis on SMC in G0/G1, S and G2/M phase in exposure to 250 ppm of CO condition for 6 h. (C) There was a significant difference in cell percentage in G0/G1 and S phase between SMC and CO-treated SMC (p=0.043). (D) Representative flow cytometric analysis on HuVEC in G0/G1, S and G2/M phase in normal culture condition. (E) Representative flow cytometric analysis on HuVEC in G0/G1, S and G2/M phase in exposure to 250 ppm of CO condition for 6 h. (F) There was also a significant difference in cell percentage in G0/G1 and S phase between HuVEC and CO-treated HuVEC (p=0.039).

